Getting started
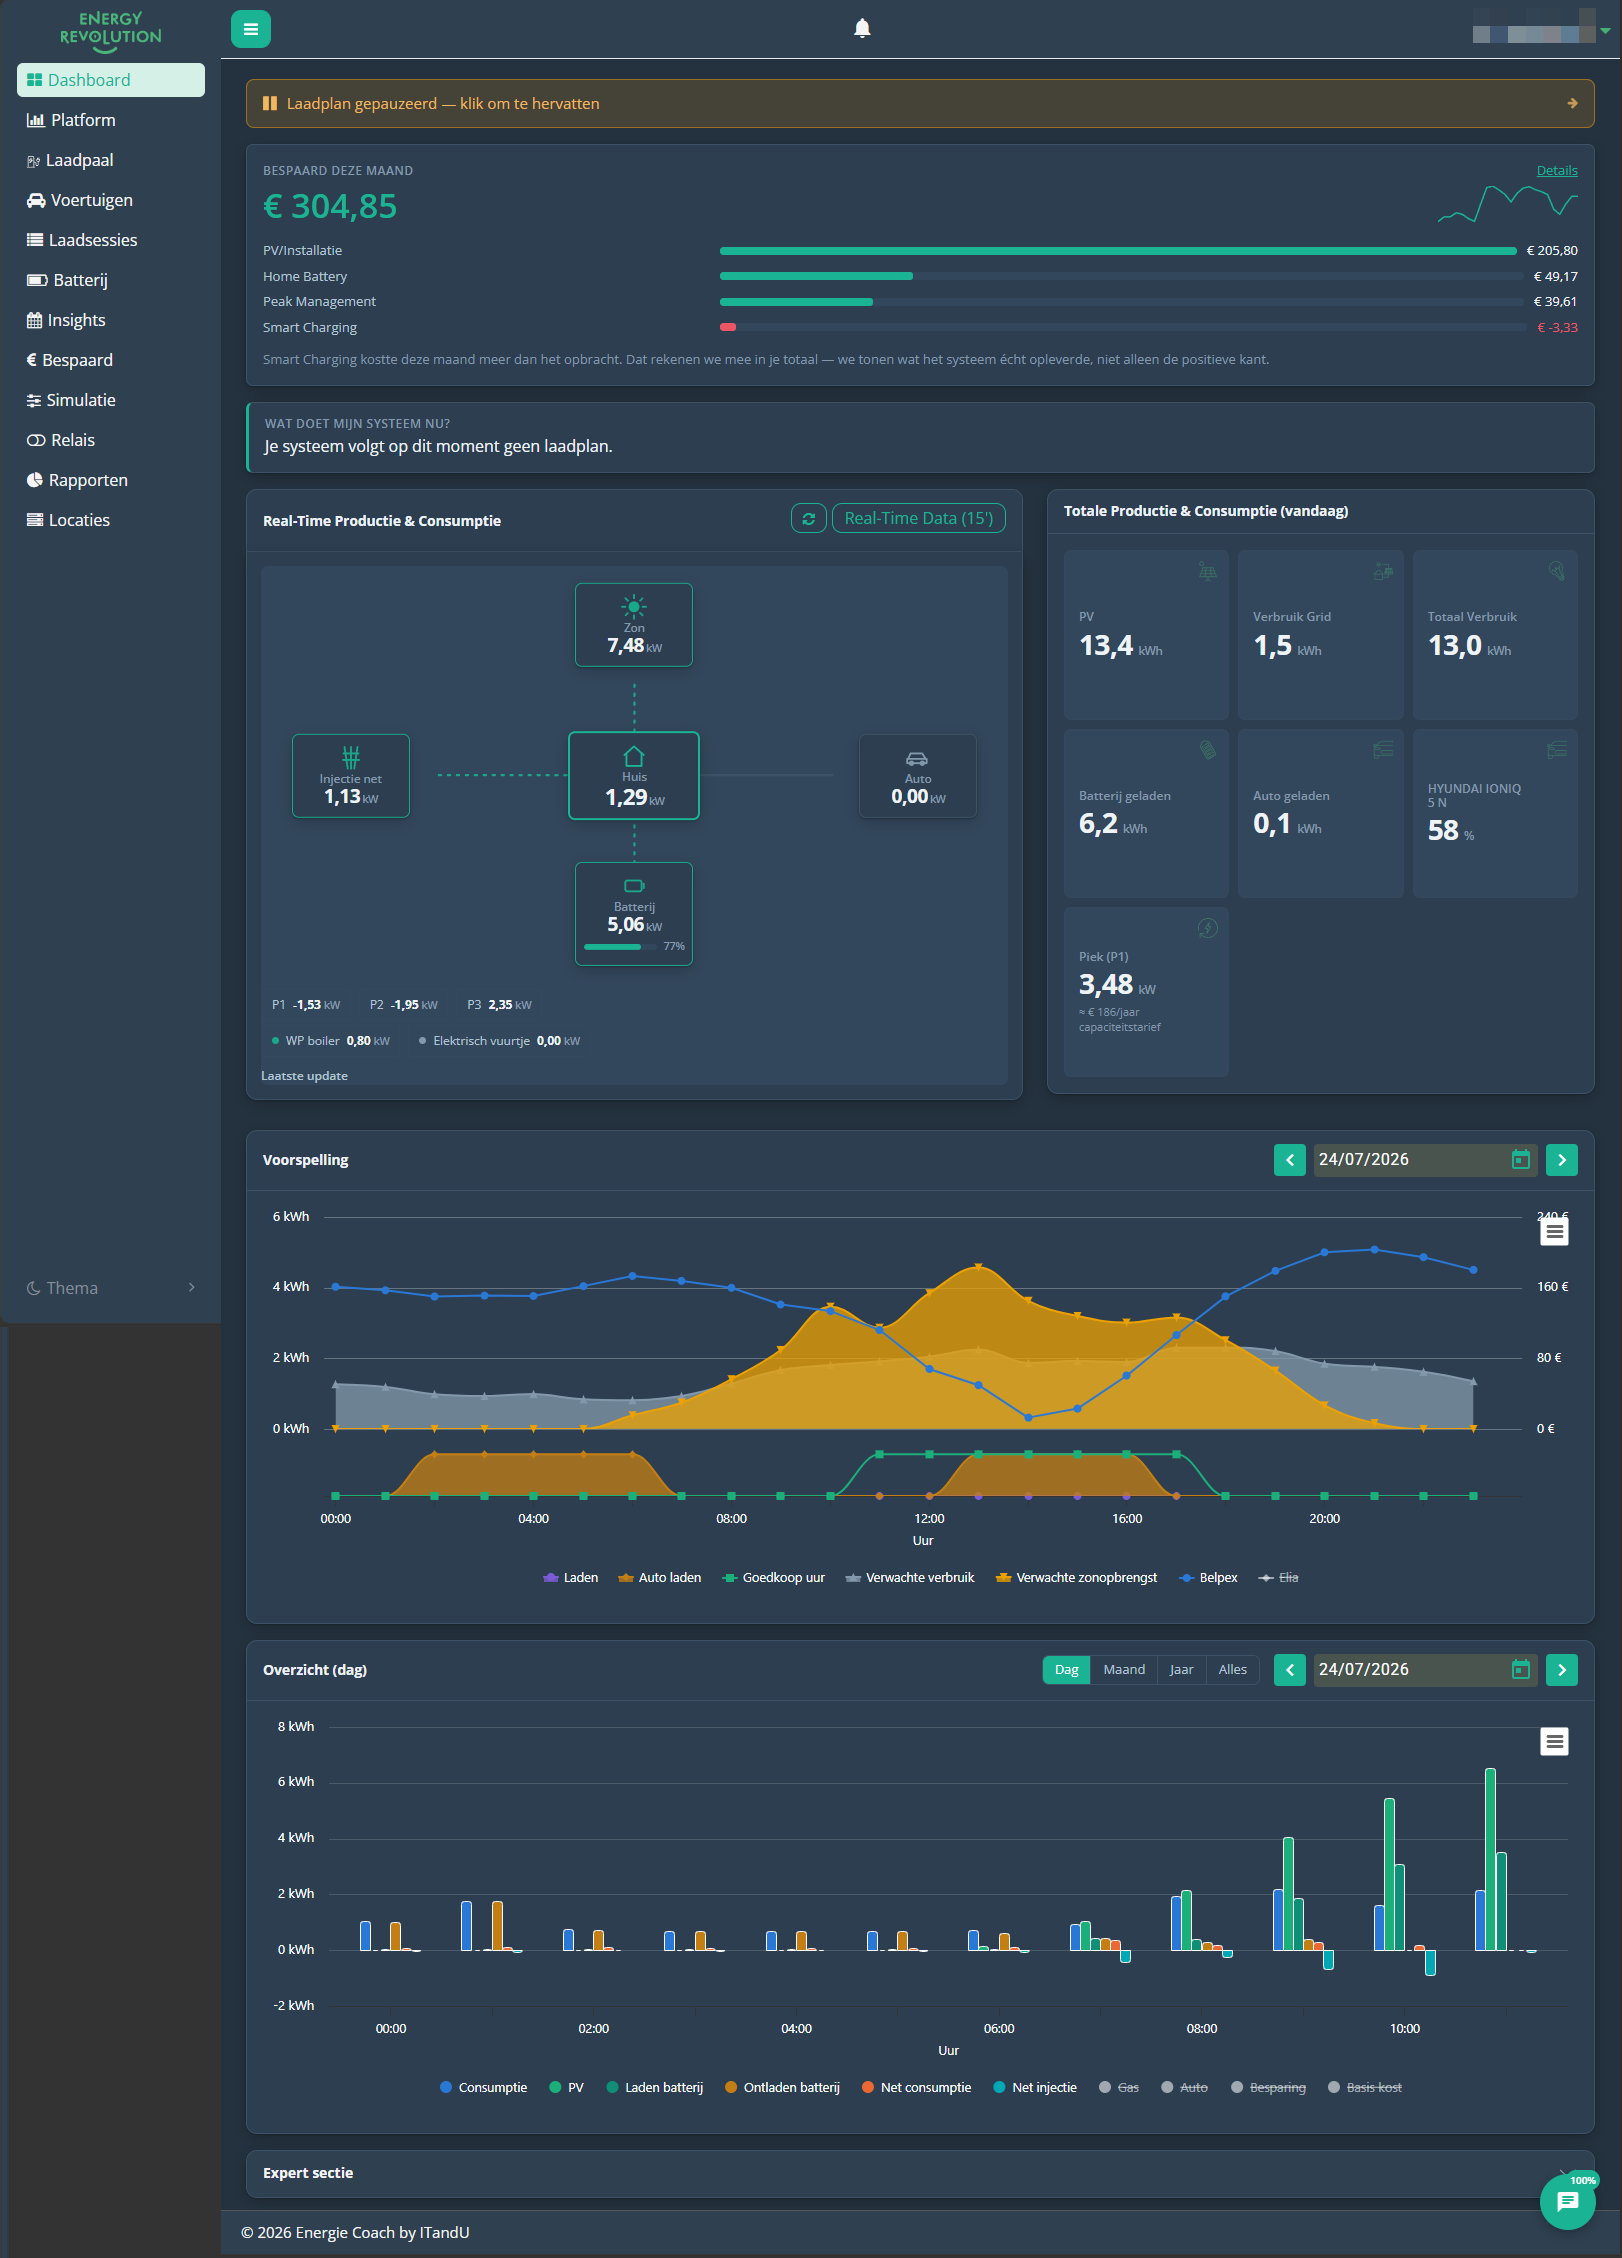
The dashboard shows your energy in real time.
Logging in
- Go to portal.energyrevolution.be in your browser (or open the app on your phone).
- Sign in with your account. You use the same login everywhere on the Energy Revolution platform — if you're already signed in elsewhere, you'll be let straight through.
- First time? Your installer created your account — use the details from your welcome e-mail and set your own password.
Add the site to your home screen for one-tap access — it then works like an app.
The portal is entirely in Dutch. There is currently no language switcher in the interface — this manual translates the Dutch labels for you as you go.
Your dashboard at a glance
The home screen reads top to bottom: first what your system earns you, then what it is doing right now, and only then the figures and charts.
What your system earns you, and what it's doing
| Block | What it shows |
|---|---|
| Bespaard deze maand ("Saved this month") | What your installation earned this month, with a bar per category (solar production, home battery, peak shaving, smart charging). A category can come out negative — we count that honestly towards your total. |
| Wat doet mijn systeem nu? ("What is my system doing now?") | One plain-language sentence about what is happening right now and why — for example, why your battery is or isn't charging. |
| Laadplan vandaag ("Today's charging plan") | The hours charging is scheduled today, with the reason per hour. Only appears when there is a plan. |
Bespaard deze maand is not available on every installation yet — it is being rolled out gradually. If you don't see the block, it isn't switched on for your installation yet.
Real-Time Productie & Consumptie ("Real-time production & consumption")
The flow diagram shows your energy right now. Each tile is a part of your installation — Zon (sun), Net (grid), Huis (home), Batterij (battery) and Auto (car) — and the dotted line between them shows which way the energy is moving:
- Green — you are producing, storing, or feeding back to the grid.
- Red — you are drawing energy in: from the grid, or out of your battery.
The battery tile also shows its state of charge in %. If you have smart relays, they appear underneath with their current power.
Real-Time Data (15') requests live readings for 15 minutes. You then also see P1, P2 and P3 — the power per phase. If someone else switches this on (on their phone, say), those values appear for you automatically too.
Totale Productie & Consumptie (vandaag) ("Today's totals")
Alongside it are your daily totals — what passed through your installation today in total, not the power at this moment:
| Widget | What it shows |
|---|---|
| PV | What your solar panels produced today, in kWh. |
| Verbruik Grid ("Grid consumption") | How much you drew from the grid today, in kWh. |
| Totaal Verbruik ("Total consumption") | What your home used in total today, in kWh. |
| Batterij geladen ("Battery charged") | How much went into your home battery today, in kWh. |
| Auto geladen ("Car charged") | How much went to your car today, in kWh. |
| Piek (P1) ("Peak (P1)") | Your highest power draw this month via the P1 meter, in kW — this sets your capacity tariff. |
Charts
- Voorspelling ("Forecast") — today's electricity price together with your expected consumption and solar yield, and a band underneath showing when charging happens and which hours are cheap. Use the legend to switch lines on or off; your choice is remembered.
- Overzicht ("Overview") — your energy over a longer period. Use Dag / Maand / Jaar / Alles (day / month / year / all) to pick the period, and the arrows and date picker to move through it.
Right at the bottom is the Expert sectie ("Expert section") with technical details such as inverter status and battery voltage. Expand it only if you need it.
Navigating the portal
At the top / in the menu you'll find:
| Item | What it's for |
|---|---|
| Dashboard | Your live energy flows and today's totals. |
| Laadpaal ("Charger") | Settings and mode of your charging point. |
| Voertuigen ("Vehicles") | Your connected cars and their charging status. |
| Laadsessies ("Charging sessions") | History of your charging sessions. |
| Batterij ("Battery") | Your home battery settings. |
| Insights | Detailed energy insights. |
| Bespaard ("Saved") | Your savings overview. |
| Simulatie ("Simulation") | Run "what-if" scenarios. |
| Relais ("Relays") | Your smart relay settings. |
| Rapporten ("Reports") | Reports over a chosen period. |
| Locaties ("Locations") | Overview if you manage more than one installation. |
Your user menu (top right) has Instellingen ("Settings"), Meldingen ("Notifications") and Afmelden ("Sign out").
First things to set up
To get the most out of the system:
- Have an electric car? Turn on "Thuisbatterij mag de auto helpen laden" ("Home battery may help charge the car") under Batterij → "Batterij ondersteunt het laden van de auto" ("Battery → Battery supports charging the car").
- Connect your car so it can be charged smartly, under Voertuigen.
- Check your energy contract — see Energy contract & dynamic tariffs.