Savings & reports
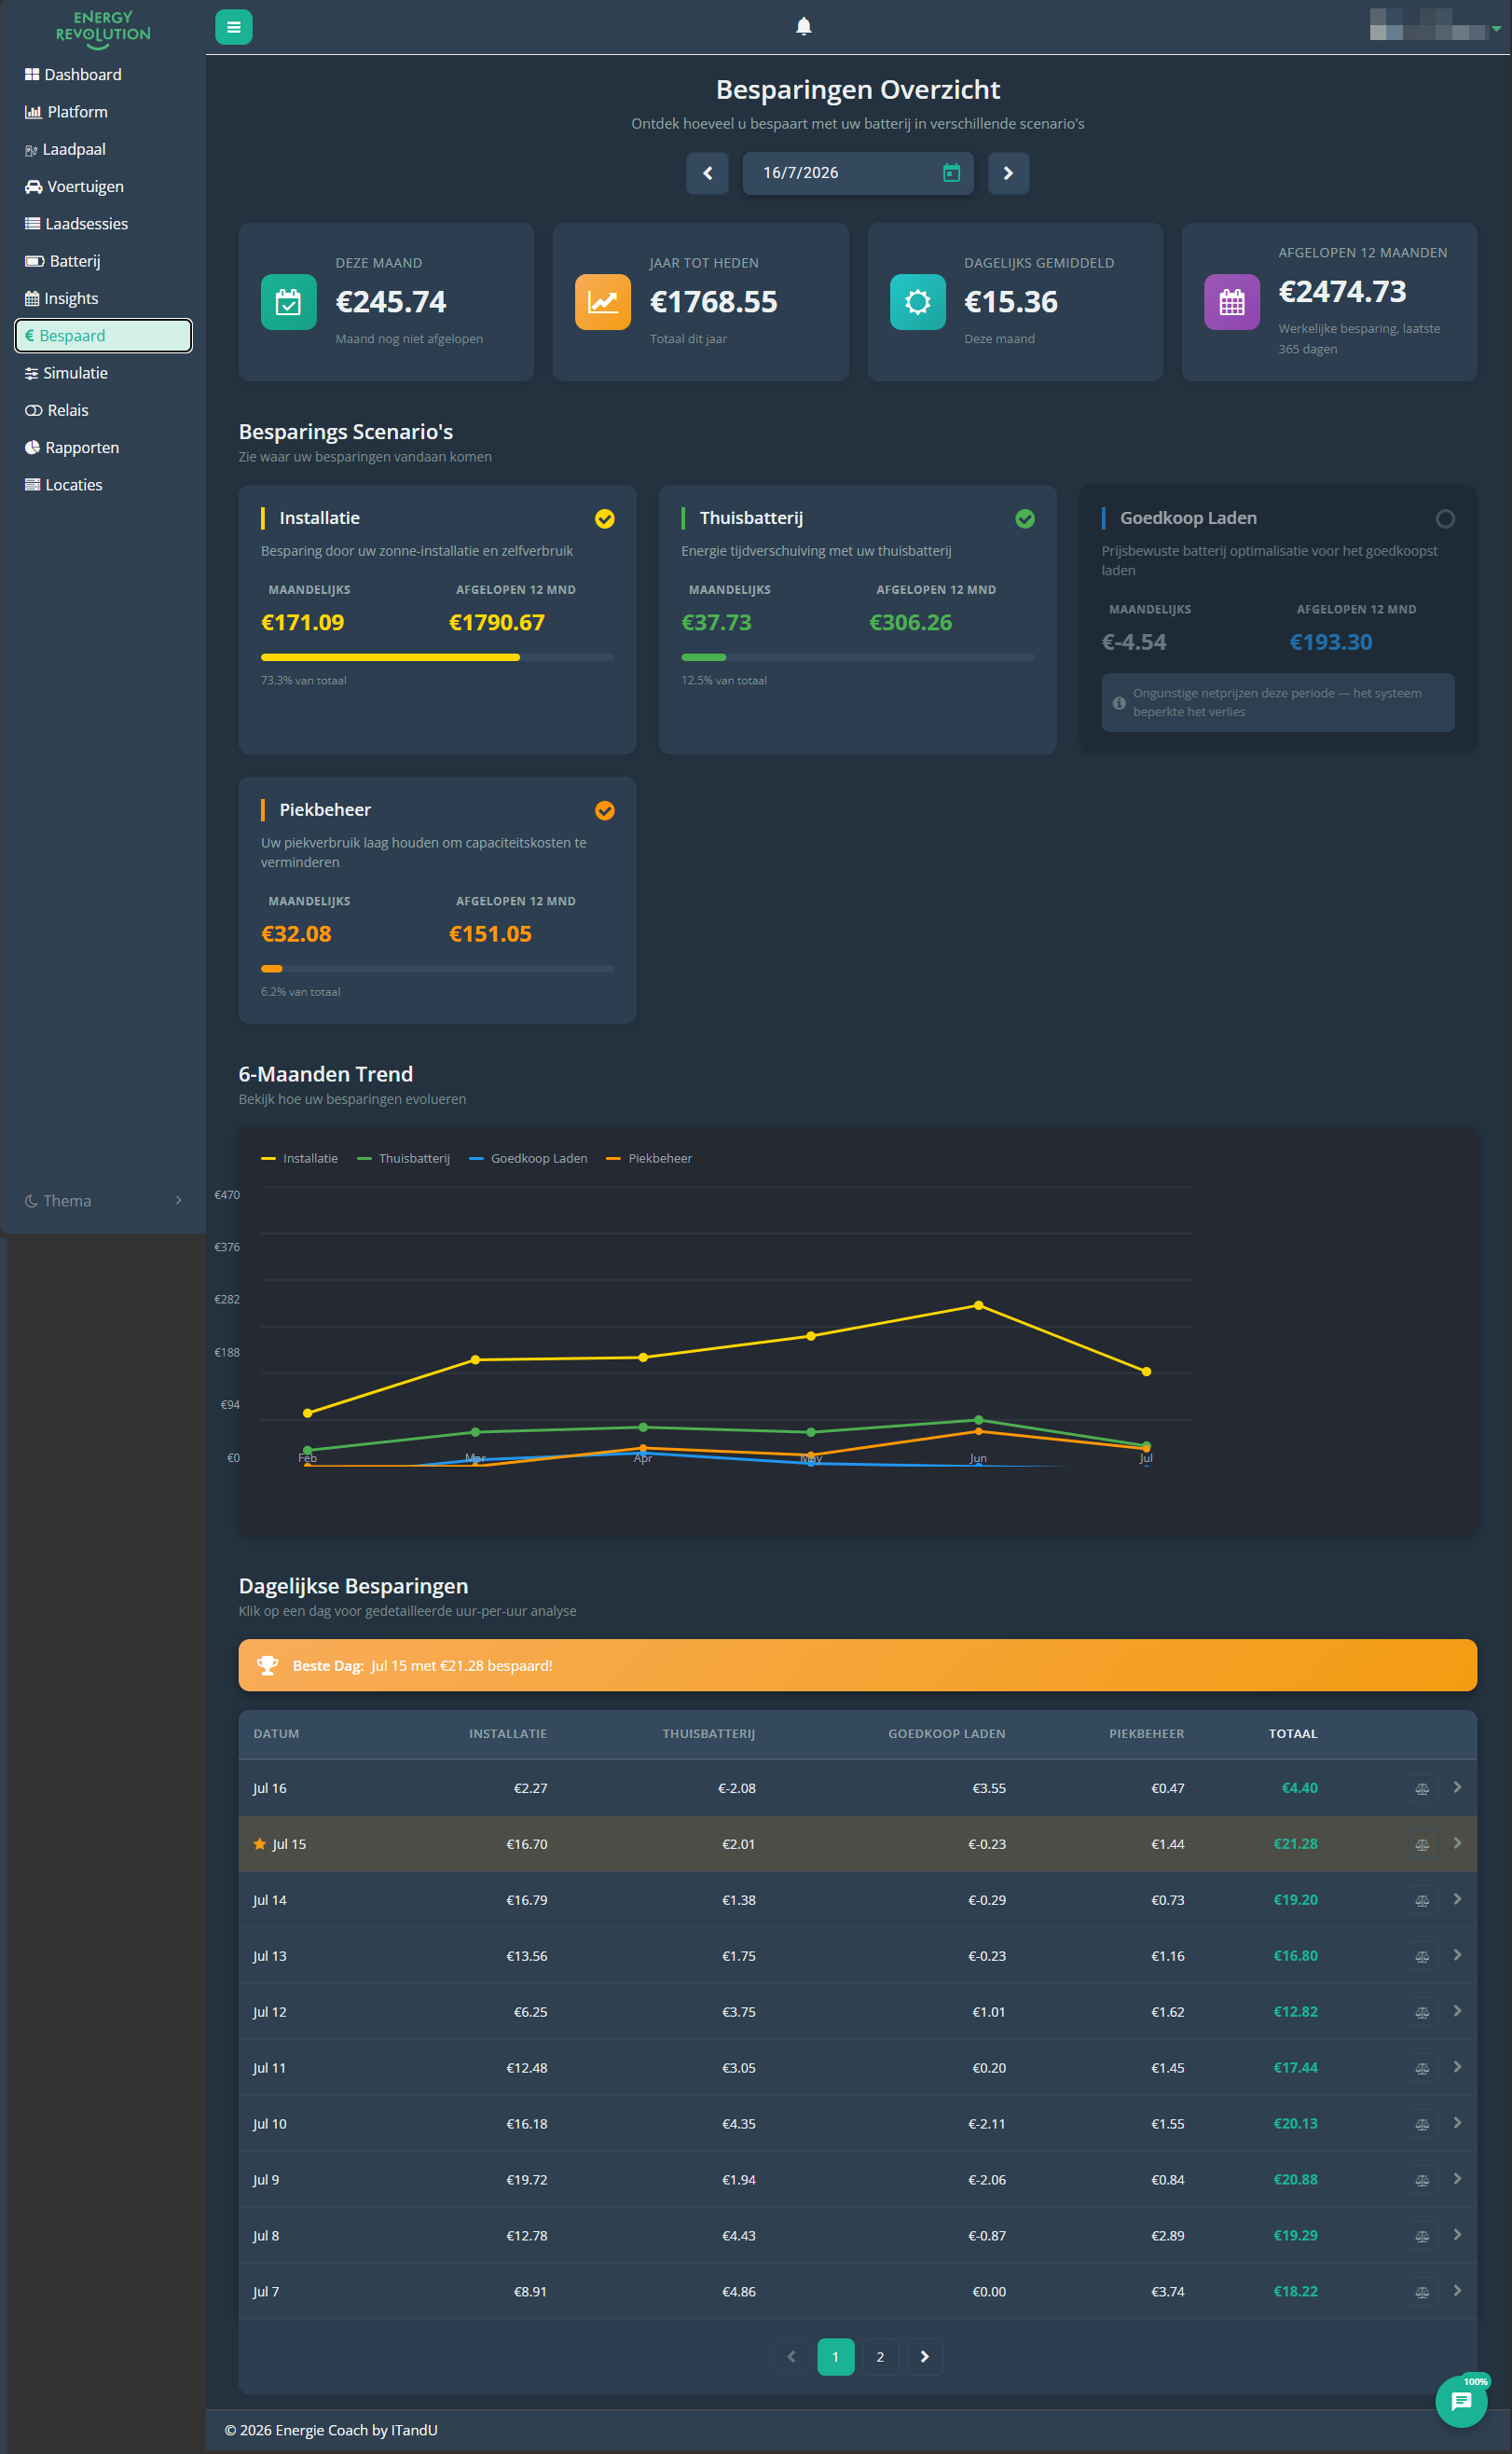
The Besparingen Overzicht (savings overview) with the four cards and scenarios.
Under Bespaard ("Saved") you'll find the Besparingen Overzicht ("Savings overview") page: an estimate of what the smart system saves you, compared with a home without a battery, smart charging or price optimisation.
The cards at the top
| Card | Period |
|---|---|
| Deze Maand ("This month") | Savings since the start of the current month. |
| Jaar tot Heden ("Year to date") | Savings since 1 January this year. |
| Dagelijks Gemiddeld ("Daily average") | Average savings per day. |
| Afgelopen 12 Maanden¹ ("Last 12 months") | Savings over the past year. |
¹ See this card labelled "Totaal Gemeten" ("Total measured") instead? That depends on an account setting — the content is comparable, only the label differs.
Where the savings come from
Savings are broken down into categories:
- Installatie ("Installation") — the base value of your solar panels: every kWh of your own production you use instead of buying.
- Thuisbatterij ("Home battery") — extra savings from storing surplus instead of exporting it (cheaply), and giving it back in the evening.
- Goedkoop Laden ("Cheap charging") — savings from charging your battery and/or car during the cheapest hours on a dynamic or day/night contract.
- Piekbeheer ("Peak management") — savings from lowering your peak power draw, which can reduce your capacity tariff.
Besparing door slimme relais wordt gemeten sinds juni 2026 — eerdere periodes bevatten deze besparing niet.
("Smart-relay savings have been measured since June 2026 — earlier periods don't include this saving.") If you've had smart relays longer than that, their full savings history won't show up in the charts.
Savings scenarios and trend
Besparings Scenario's ("Savings scenarios") show what you would save under a different energy plan or with a larger battery — useful to check whether a change is worth it.
The 6-Maanden Trend ("6-month trend") shows how your savings evolve across the seasons — normally higher in sunny months, lower in winter.
Savings figures are estimates, not an invoice. Look at the trend over time rather than any single day.
Reports
Under Rapporten ("Reports") you compare periods (this month vs. last, this year vs. last) and track how your production, consumption and savings evolve over the longer term.